
Abstract
One of the main propositions for cryptocurrency adoption is that it is an alternative to bad monetary policy and helps facilitate economic growth when a country’s institutions fail to do so. Bitcoin bull, Anthony Pompliano, states “We’re going to get to a situation where you need a decentralized, non-censored, non-seizable, non-inflatable, or non-debaseable asset. And when you go looking for it, you'll find Bitcoin. I believe Bitcoin’s best ally is just time. And as more people get put in situations where it could be valuable to them, they will opt in” (Gladstein). This facilitates the question: do dire economic situations actually accelerate cryptocurrency adoption? This paper aims to assess if there is any evidence that cryptocurrency is truly becoming an alternative store of value or medium of exchange in countries that have faced high inflation, poor economic conditions, or catastrophic events such as war.
The results that this study yielded were very interesting. The vast majority of the regressions ran appeared to validate the hypothesis. Not only are there significant findings in peer-to-peer transaction volume and different forms of economic stress, but there was a divergence in these findings when comparing peer-to-peer transactions and overall cryptocurrency adoption.
Methodology
This study has compiled data from 149 regions. The economic datasets used for this study originate from the International Monetary Fund. This data is mostly complete, but some patchwork needed to be done on a few regions due to instability and civil war, namely Afghanistan, Syria, and Lebanon, which all had missing data points pertaining to metrics such as inflation and GDP. Data that did not come directly from the International Monetary Fund is listed in the dataset, which is attached in the bibliography. Statistics from the International Monetary Fund includes GDP growth rate, nominal GDP denoted in USD, and inflation. Datasets range from 2009-2021, as 2009 was the first year of Bitcoin’s existence. Additionally, averages for the listed figures from 2009-2021 have been calculated.
Also listed are the rank and score from each country’s 2022 economic freedom index, created by the Heritage Foundation. This index scores countries based on an average of grades given for property rights, government integrity, judicial effectiveness, tax burden, government spending, fiscal health, along with business, labor, monetary, trade, investment, and financial freedom. Cryptocurrency adoption data comes from Chainalysis’ 2021 Geography of Cryptocurrency study. Metrics include each country's cryptocurrency adoption score, cryptocurrency adoption rank, and peer-to-peer transaction volume rank. Studying potential correlations with these datasets aid in identifying if cryptocurrency adoption does accelerate under poor economic conditions. There are two major hypotheses that this study will assess.
-
If cryptocurrency is considered an alternative in the face of high inflation, poor economic output in terms of GDP, or other forms of economic duress, then peer-to-peer transaction volume should be higher in such countries.
-
Peer-to-peer transaction volume should be a better indicator than overall cryptocurrency adoption, because many people under quality economic conditions use cryptocurrency as a risk-on investment asset that has a number of other use cases. Hobbyist crypto users are also interested in non-fungible tokens, enjoy the humorous factor of buying certain currencies, or are interested in any number of other use cases of blockchain technology outside of being a monetary vehicle. On the other hand, peer-to-peer transaction volume suggests that cryptocurrency is being used as a medium of exchange, implying there is some level of transactional economic activity being performed, rather than being used for the other reasons stated. Due to this, the hypothesis would suggest that there may be a divergence between overall adoption data and peer-to-peer crypto adoption data as it pertains to undesirable economic situations.
Additionally, naturalistic studies on countries who have suffered from sudden economic duress such as Libya, Venezuela, and others will be researched on their cryptocurrency adoption versus neighboring regions. Lastly, this study will aim to quantify how war impacts cryptocurrency adoption. There have been multiple claims that cryptocurrency has proved itself useful during the war between Ukraine and Russia, such as Russia using cryptocurrency to avoid sanctions and Ukrainian refugees carrying their savings denoted in Bitcoin on USB drives. Are these claims accurate and, if yes, what is the scale at which these situations are occurring?
Caveats and Other Considerations
Missing Regions
Regions that were not included in the dataset, due to missing cryptocurrency adoption data or general economic data include the following: Andorra, Antigua and Barbuda, Aruba, Bhutan, Burundi, Central African Republic, Chad, Comoros, Republic of Congo, Djibouti, Dominica, Equatorial Guinea, Eritrea, Eswatini, Grenada, Guinea, Guinea-Bissau, Guyana, Kiribati, Kosovo, Lesotho, Liberia, Marshall Islands, Mauritania, Micronesia, Nauru, Niger, Palau, Papua New Guinea, Samoa, San Marino, São Tomé and Príncipe, Sierra Leone, Somalia, Solomon Islands, South Sudan, St. Kitts and Nevis, St. Lucia, St. Vincent and the Grenadines, Sudan, Taiwan Province of China, Timor-Leste, Tonga, Tuvalu, Vanuatu, West Bank and Gaza, and Yemen.
Controlling For The 3 Inflation Outliers
Three countries had substantially higher inflation than the others. These countries were Argentina, Zimbabwe, and Venezuela. For this reason, additional regressions are included to help provide context and further validate the regressions that include these countries. Some of the regressions include them in the form of a dummy variable, other regressions exclude them altogether. The regressions will be annotated accordingly on how these countries are controlled for.
Controlling for Venezuela
Another consideration for this study is the data around Venezuela. Starting in about 2016, Venezuela went through a true hyperinflation event in which the Venezulian Bolivar completely collapsed. Due to this, the average inflation rate for Venezuela from 2009-2021 is so extreme that it hardly makes contextual sense for the purposes of this paper. The average inflation rate for this time period is stated at over 7000%, for reference, the two next highest average inflation rates for this time period are Zimbabwe at 77% and Argentina at 44.5%. Due to this, I have normalized Venezuela's inflation rate at 111%, which is the estimated inflation rate in 2015 prior to the currency collapse event. There are three reasons why this was an appropriate adjustment to make. First, Venezuela breaks the scaling on any of the scatter plot graphs due to how much of an outlier it is. This makes it very difficult to illustrate some of the trends in the data. Second, the 7000% inflation rate will only help to further validate the hypothesis that peer-to-peer transactions increase in times of economic duress, as Venezuela is one of the top ranking countries for peer-to-peer transactions. The only issue that will be caused by this normalization from a statistical results perspective is that it will reduce some of the general variance in the data. However, regressions that exclude the three outliers and regressions with dummy variables are provided, which will control for the adjustment made on Venezuela's inflation number. Third, inflation metrics stop being relevant in events of complete currency collapse as the currency becomes completely useless. The difference from an actual use perspective between a currency that has inflated 5000, 7000, or 10,000 percent is just documentation. Any currency that is inflating at such levels is almost impossible to use for any relevant economic purposes.
Controlling for Vietnam
Vietnam is an outlier in regressions pertaining to overall cryptocurrency adoption score, as Vietnam has a perfect score in the Chainalysis data, but no other country has a perfect score. For this reason, regressions with the cryptocurrency adoption score will have versions that include Vietnam and versions that do not include Vietnam.
Inflation Dummy Variable Setup
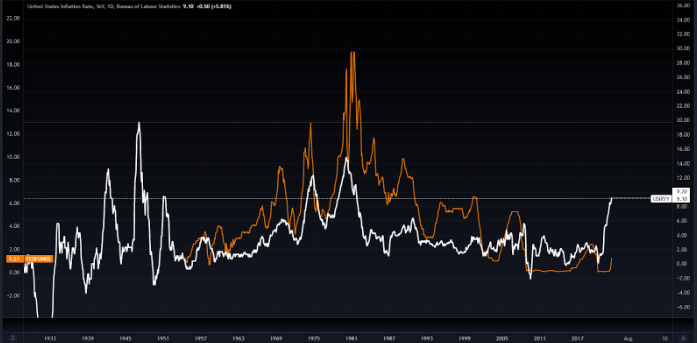
Some regressions have the average inflation data serving as a dummy variable, where 0 equals “not high inflation” and 1 equals “high inflation”. For the purposes of this study, any country with above 8% average inflation from 2009-2021 was denoted as “high inflation”. 8% is the threshold because, historically, the United States Federal Reserve has made very concentrated efforts in raising interest rates when year over year inflation has trended toward this metric. While the United States Federal Reserve is not necessarily the standard in monetary policy, one can consider that the Federal Reserve taking strong actions to combat inflation as it has neared 8% levels in a 12 month period would suggest that the inflation rate is unsustainably high and would cause substantial economic harm if left unchecked. To illustrate this, below is a chart of the United States Inflation Rate overlaid with the Federal Funds Rate. Ceteris Paribus, Federal Reserve tends toward hiking interest rates when inflation consistently remains higher than its 2% target. Treating inflation as a dummy variable will help further control for outliers in the data.
Crime and Illicit Activity
The last consideration for the provided data is illicit activity. When assessing peer-to-peer transaction volume in countries that are less developed, it’s important to consider the amount of crime and illicit activity occurring within the cryptocurrency market. Cryptocurrency use could potentially be higher in countries with higher crime, which also tend to be countries that have less developed economies (Alborg). There is unfortunately no way to control for what amount of peer-to-peer transactions are being used for illicit activity, but there are transactions that are being used for crime. While black markets can still count as economic activity, this is not activity that is desirable for assessing if cryptocurrency is actually used as a monetary alternative for countries in poorly developed economic situations,
Regression Analysis
In total, 18 regressions are listed. There are three primary crypto adoption metrics that are measured against three different economic metrics, totaling for 9 primary regressions. The other regressions listed are derivatives of these metrics as to control potential outliers in the data and provide additional insight. Each of the regressions will receive their own annotations on how they relate to the hypothesis, as well as how they relate to one another.
Overall, the majority of the regressions appear to have confluence with the hypothesis. Peer-to-peer transaction volume does appear higher in countries under different forms of economic stress. While the strength of the outputs vary, the trend is consistent when measuring the peer-to-peer data against inflation, GDP, and economic freedom. Additionally, while the results vary, the trends pertaining to overall crypto adoption appear to be weaker than that of the peer-to-peer data, which is consistent with the inferences of the hypothesis. This suggests that economic stress is potentially a catalyst to encourage someone to adopt cryptocurrency as a medium of exchange, while it does not encourage people to adopt cryptocurrency for the other uses that have more enthusiast qualities.
Inflation Regressions
The first and most extensive set of regressions are measuring the three cryptocurrency adoption parameters against inflation. This set of regressions has the most variations provided to attempt to control for the high inflation outliers in two separate ways. The first is controlling for inflation by using a dummy variable, where any country with over 8% average yearly inflation from 2009-2021 is deemed “high inflation”, while all others are “not high inflation”. In addition to this, separate regressions are provided simply by removing the three outliers of Venezuela, Argentina, and Zimbabwe from the data.
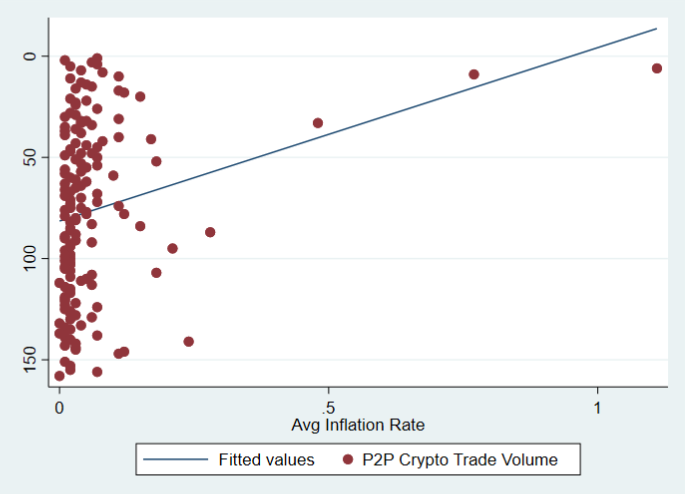
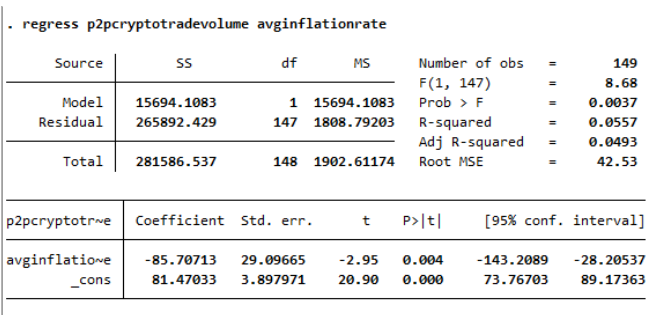
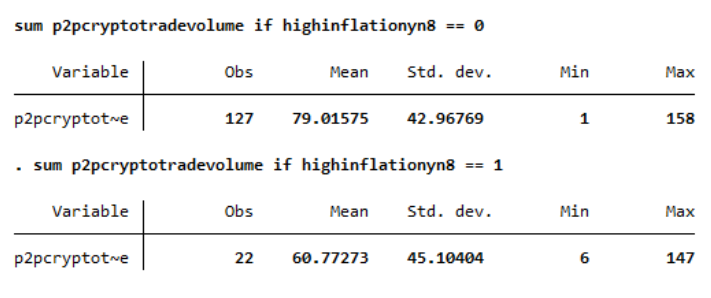
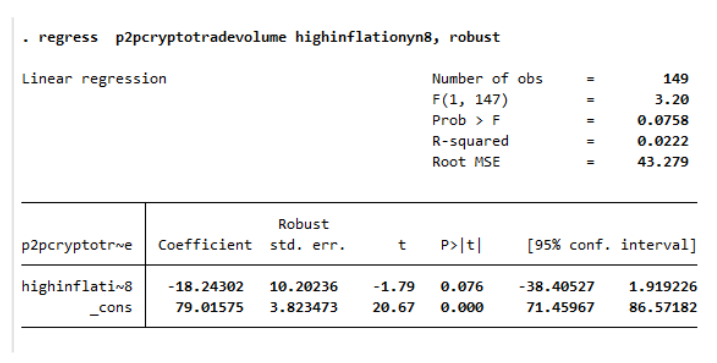
This regression of peer-to-peer transaction data and average inflation rates shows that there is a positive trend in peer-to-peer transaction ranking in countries with higher inflation. The regression is significant (P = .004). While cryptocurrency is not often regarded as an inflation hedge in developed nations, this regression suggests that less developed nations with high inflation do find use of cryptocurrency as a medium of exchange. Controlling for outliers, the above regression includes inflation as a dummy variable, where the metric for “high inflation” was any country that had higher than 8% average yearly inflation from 2009-2021. This regression yields the same positive trend between peer-to-peer transactions and high inflation. It is significant (P = .076) as well.
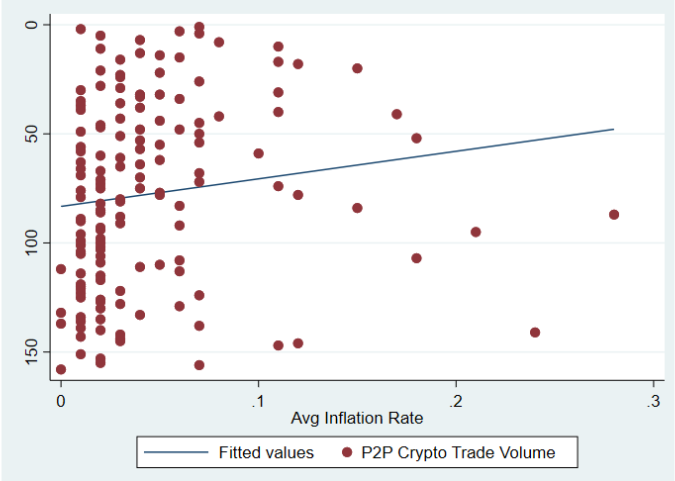
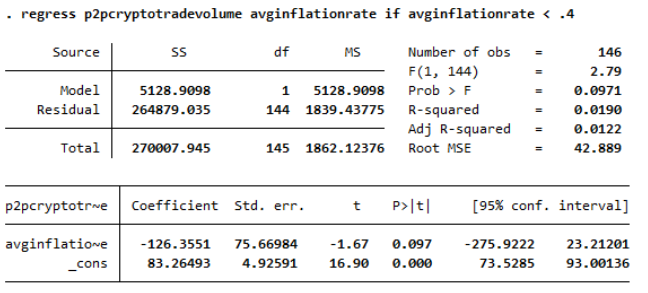
Controlling for outliers using another method, the above regression has removed Venezuela, Argentina, and Zimbabwe from the regression. These three countries were the largest outliers in terms of their inflation rate, and all three countries rank highly for peer-to-peer transaction volume. Venezuela ranks 6th, Argentina 33rd, and Zimbabwe 9th. Controlling for these countries, the results do still show a significant trend (P = .097).
All three variations of the peer-to-peer ranking measured against average inflation display results that are consistent with the hypothesis.
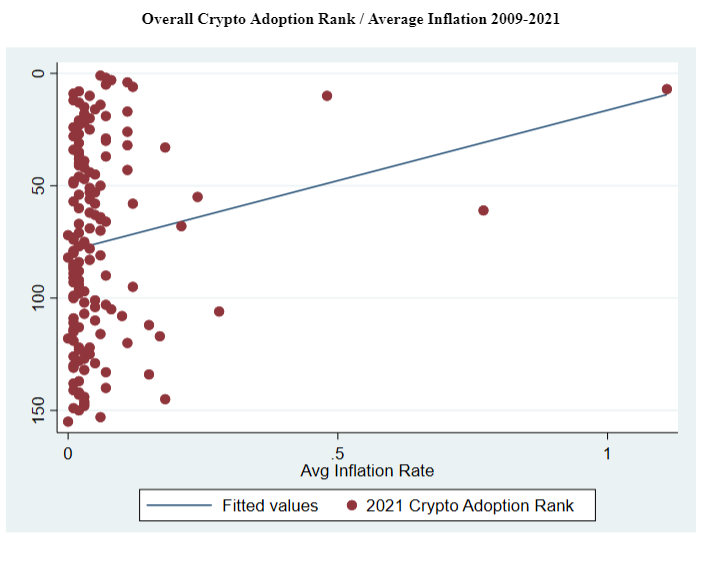
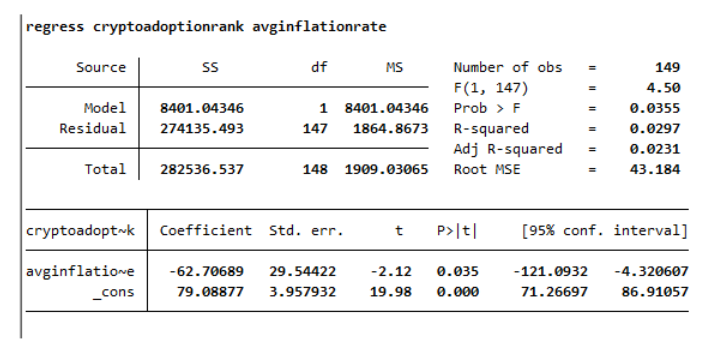
When measuring overall crypto adoption ranking against inflation, which includes measurements for general on-chain value received along with peer-to-peer adoption, the results are significant (P =.035). However, the P value of this regression is less significant than the P value of the peer-to-peer / average inflation regression of P = .004. For the regressions to be consistent with the hypothesis, it would be ideal that the P values for overall crypto adoption ranking and crypto adoption score are generally less significant than the peer-to-peer P values.
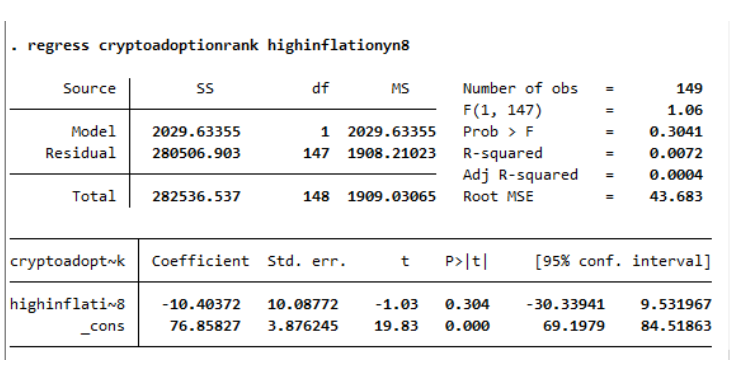
When running the same regression, but with inflation set as a dummy variable where the metric for “high inflation” is any country that had higher than 8% average yearly inflation from 2009-2021. The results for this regression are not significant (P = .304). The P value for this regression for peer-to-peer transaction ranking was P = .076.
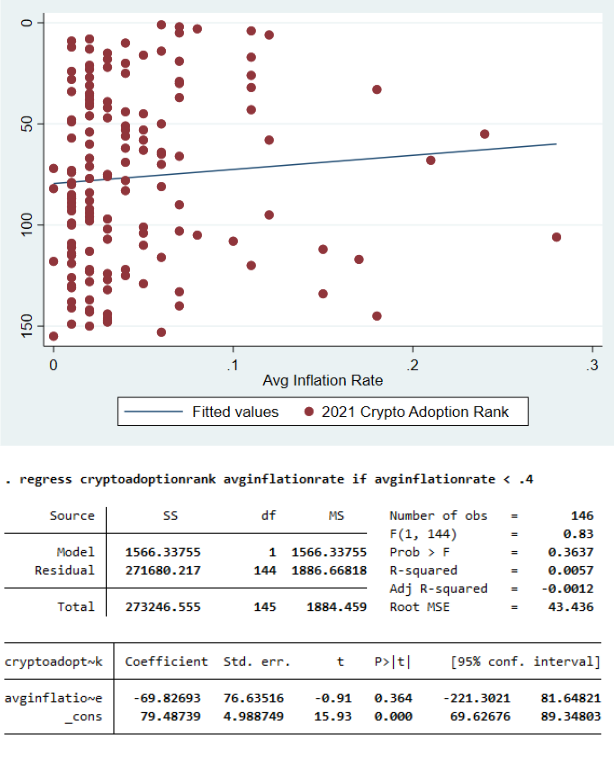
Above is the overall crypto adoption ranking and average inflation regression, but controlling for the outliers of Venezuela, Argentina, and Zimbabwe once again by removing them. The results for this regression are not significant (P = .364). Additionally, the P value of this regression is less than the peer-to-peer regression where P = .097. It is worth noting that the R-squared for this regression is very low, adding support to the idea that these two metrics are not strong predictors of one another.
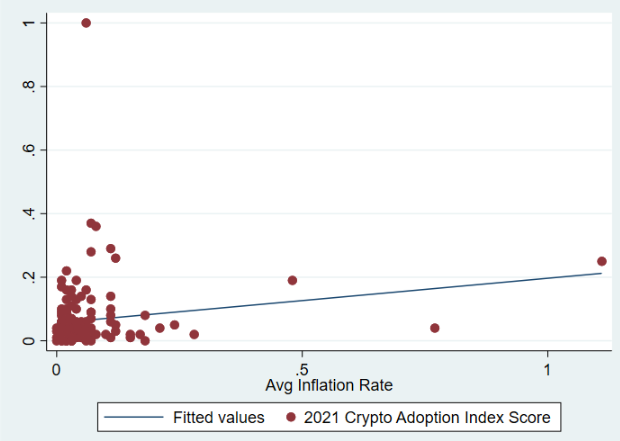
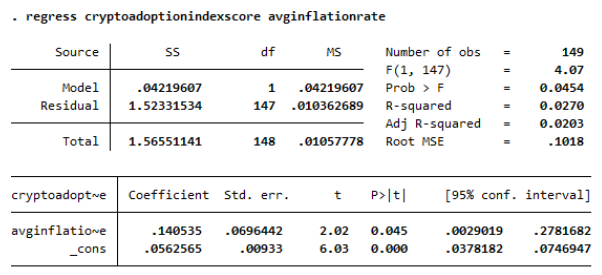
While the other regressions measure how countries rank comparatively to one another, regressions measuring the overall crypto adoption score measure the data based on the actual metric that the rankings come from. While the score for peer-to-peer transaction volume is not listed in the Chainalysis data, it is still helpful to see how the overall crypto adoption score compares to the economic data. This regression measuring the overall cryptocurrency adoption score and average yearly inflation from 2009-2021 is significant (P = .045). Once again, however, the P value for this regression is less significant than the P value for the peer-to-peer regression of P = .004.
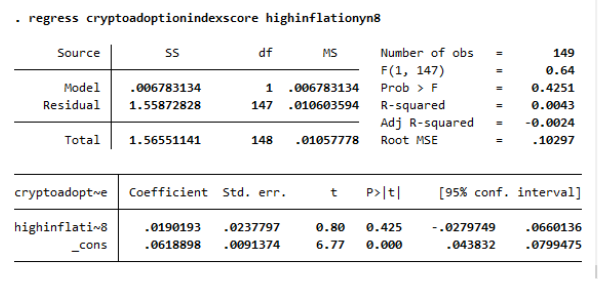
Measuring overall crypto adoption score against the high inflation dummy variable does not yield significant results (P = 0.425). This is another instance in which peer-to-peer transaction volume yielded more significant results with a P value of .076 when regressed with the high inflation dummy variable.
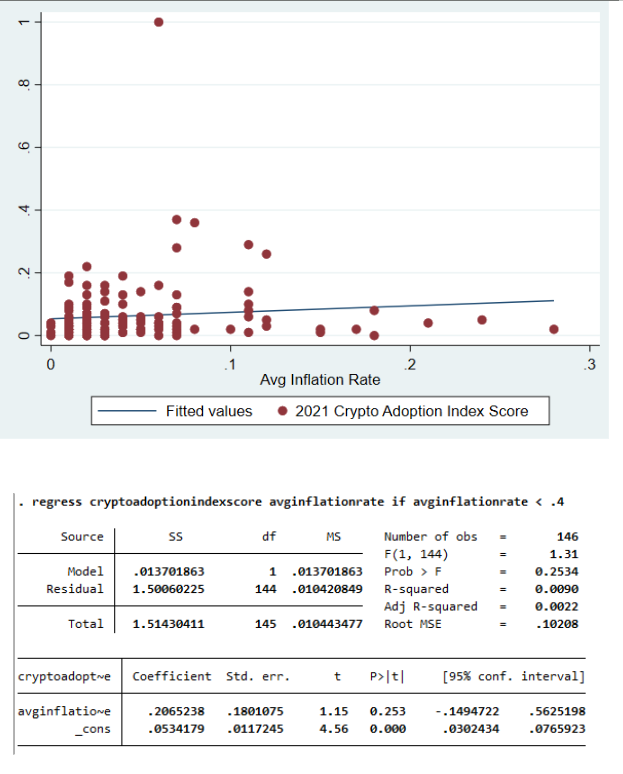
The above regression shows the cryptocurrency adoption score regressed with the inflation data, controlling for the outlier inflation countries of Venezuela, Argentina, and Zimbabwe. The results were not significant (P = .253), and were comparatively less significant than the peer-to-peer transaction data which produced a P value of .097.
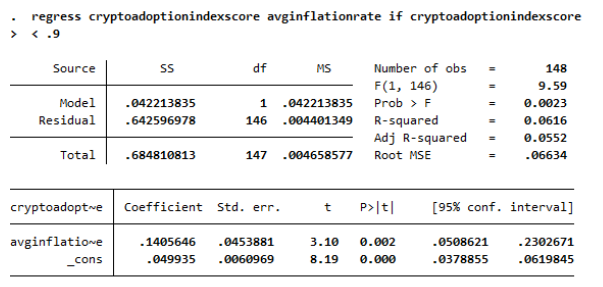
In conclusion of inflation related regressions, the data presents a comparison of the overall cryptocurrency adoption score with the Vietnam outlier removed to the average inflation rate. These results are significant (P = .002). Removing Vietnam allowed for the positive trend pertaining to inflation to become much more apparent, as Vietnam doesn’t have a very high average inflation rate from 2009-2021, but has the highest cryptocurrency adoption score. Vietnam’s average inflation rate from 2009-2021 is 5.51%.
Economic Freedom Regressions
The next set of regressions pertain to the economic freedom index score of each country. The economic freedom index by the Heritage Foundation measures several indicators that might signal economic stress in ways other than inflation. Some countries may have lower levels of inflation, but still rank very low on metrics such as business freedom or property rights. While the economic freedom index is more arbitrary than hard inflation numbers, the basis for which each country is graded is the same, and therefore can provide helpful comparative context when trying to measure alternative forms of economic stress. Just like the inflation regressions, it is ideal to see a confluence of countries that rank highly in peer-to-peer transaction volume having lower levels of economic freedom in order to be consistent with the hypothesis. Additionally, it is ideal if the peer-to-peer regressions are more statistically significant than the general cryptocurrency adoption regressions.
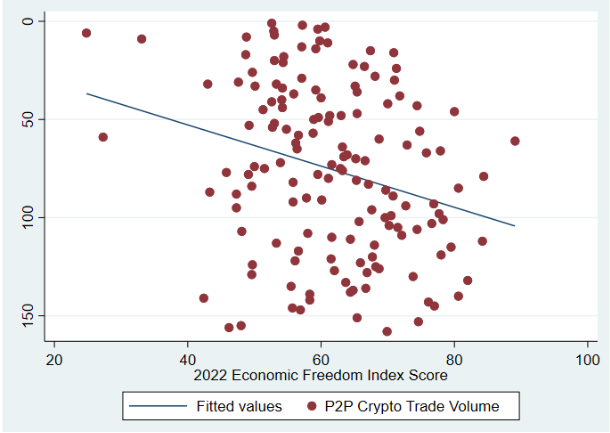
The regression measuring peer-to-peer transaction volume ranking and economic freedom index score is very significant (P = .001). It is also worth noting that the R-squared measures at .071. The data suggests countries that rank poorly in terms of economic freedom tend to rank higher in their respective peer-to-peer transaction volumes.
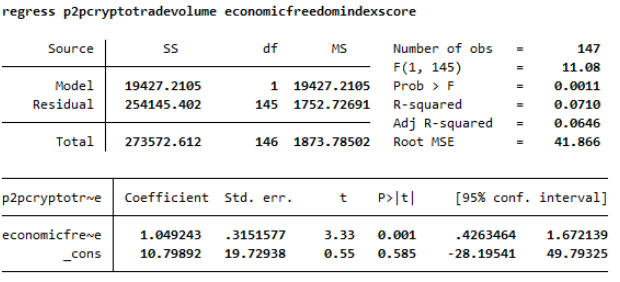
Overall cryptocurrency adoption ranking is not significant (P =.304). This measurement diverges from the peer-to-peer transaction volume, which has a P value of .001. This divergence suggests that economic freedom might be a good indication of whether or not one is to use cryptocurrency as a monetary alternative, but it does not suggest whether or not someone is likely to adopt cryptocurrency for its other uses.
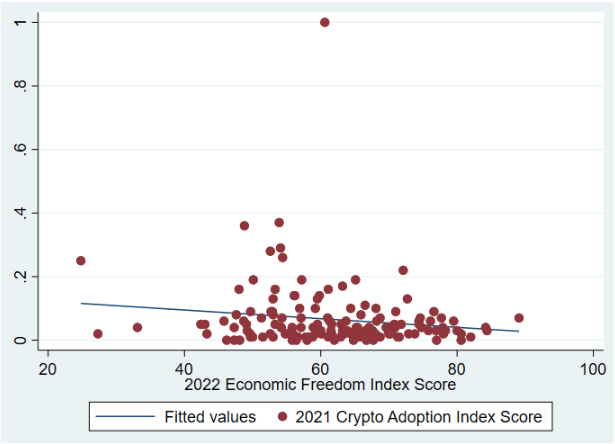
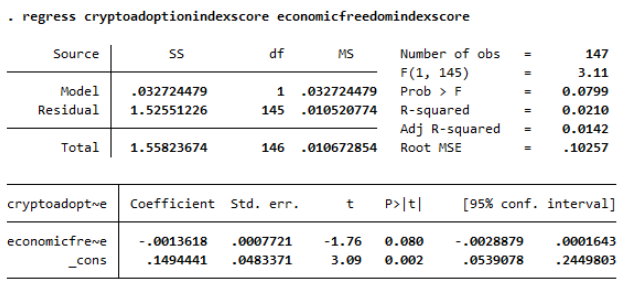
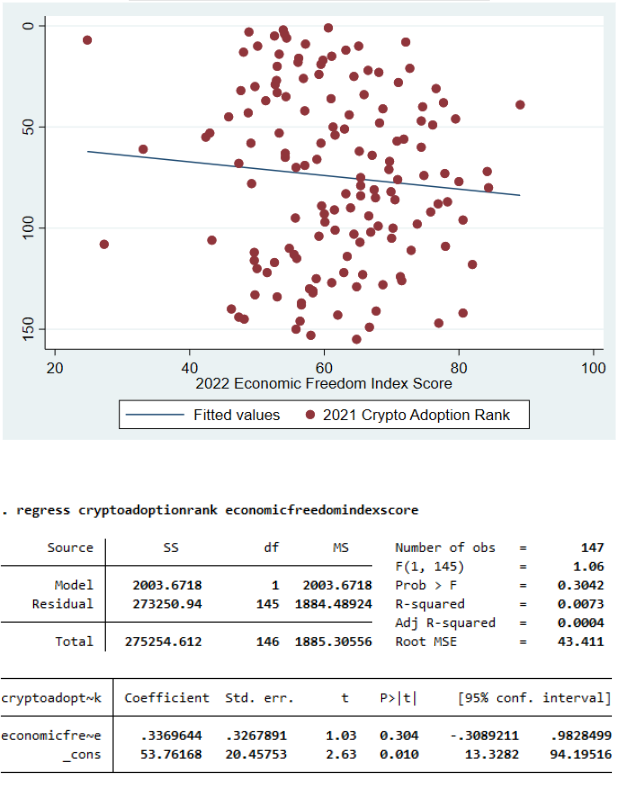
The results for the overall cryptocurrency adoption score are significant (P =.08). However, these results are much less significant than the peer-to-peer transaction volume ranking in which the P value is .001. Just like the inflation data, the overall cryptocurrency adoption regressions fail to produce more significant results than peer-to-peer data.
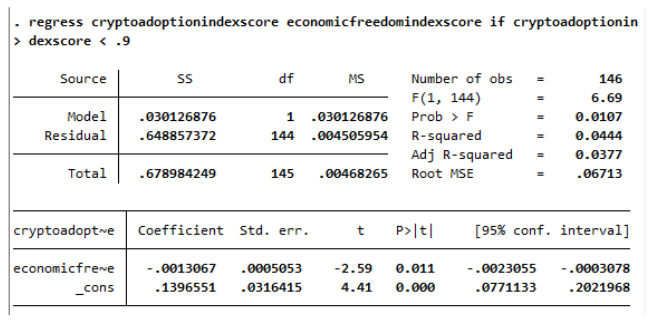
The last analyzed dataset is the overall cryptocurrency adoption score controlling for the outlier of Vietnam. When controlling for Vietnam, the crypto adoption score is still significant (P = .011). It is more significant than the regression not controlling for Vietnam (P =.08)
GDP Regressions
The final set of regressions compares the cryptocurrency adoption metrics with a nation's average GDP from 2009-2021, denoted in United States dollars. While GDP isn’t an inherent indicator of a healthy or stressed economy, a 12-year average of GDP data does provide insight on what countries are comparatively producing less output than others. This is another hard dataset that can be resourceful in providing insight on how a country reacts to cryptocurrency. Ideally, countries with lower GDP are more likely to adopt cryptocurrency for peer-to-peer transactions in order to be consistent with the hypothesis. It is also ideal if peer-to-peer regressions produce more statistically significant results than overall cryptocurrency adoption.
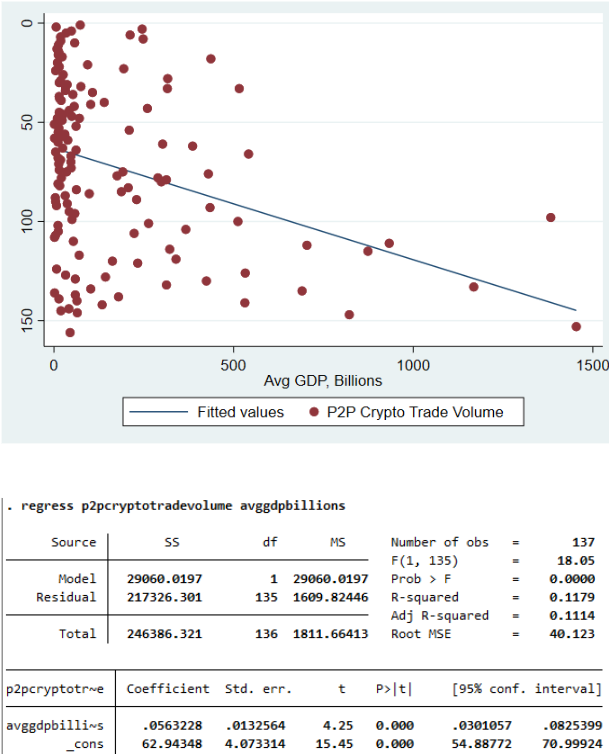
The regression of peer-to-peer transaction volume ranking and GDP is significant (P = 0.00). This suggests that countries with low GDP tend to rank higher in peer-to-peer transactions than countries with high GDP. The R-Squared is .118, which is also a highly supportive metric.
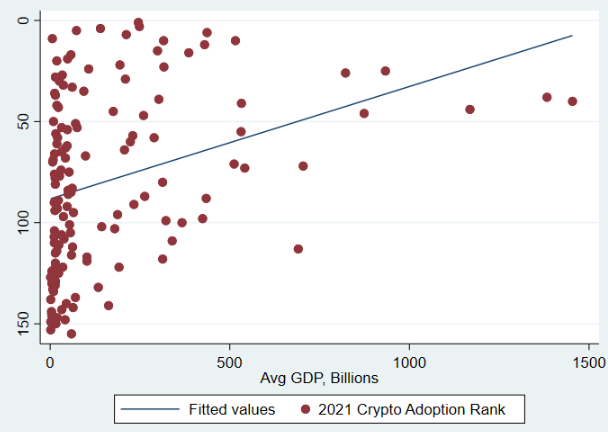
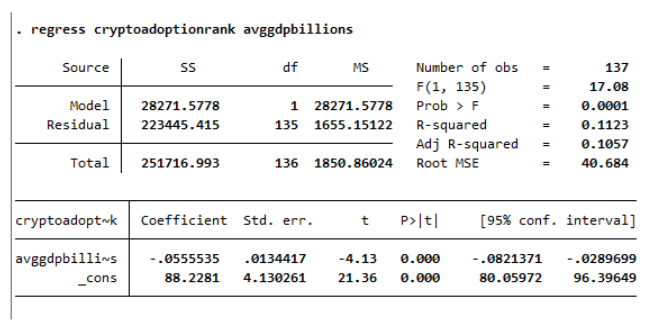
The results are also significant (P = 0.00) in regards to the regression of overall cryptocurrency adoption ranking and GDP. They are equally as significant as the peer-to-peer GDP regression. However, the data presents an upward grouping of the data, suggesting that countries with high GDP are more likely to adopt cryptocurrency for its other purposes than countries with lower GDP. Both of these results being equally as significant with a P value of 0.00, but with differing trends would suggest that there is a divergence between peer-to-peer transaction volume rankings under economic stress and overall crypto adoption under economic stress. While both developed and undeveloped countries are adopting cryptocurrency, these regressions may suggest that it is being adopted for entirely different uses and reasons.
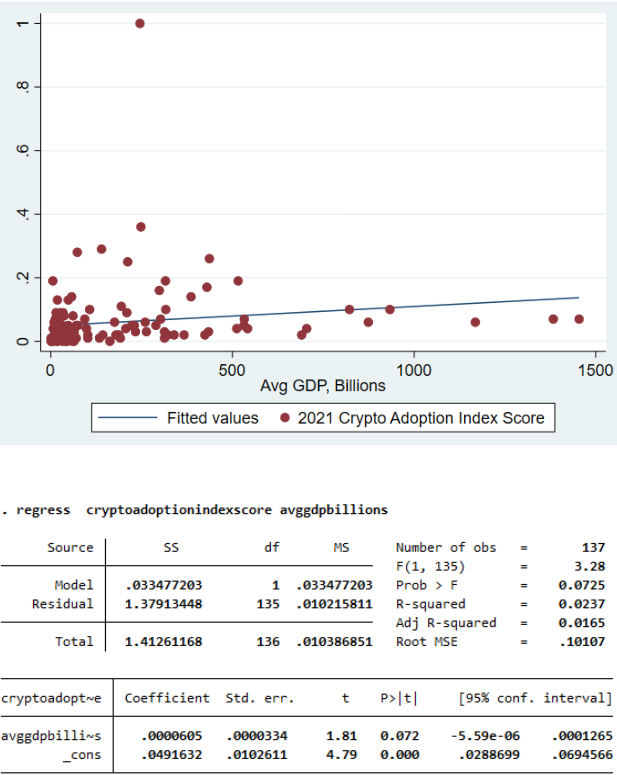
The overall cryptocurrency adoption score regressed with GDP yields a significant result (P = .072). However, this result is less significant than the results of peer-to-peer transaction volume ranking and overall cryptocurrency adoption ranking.
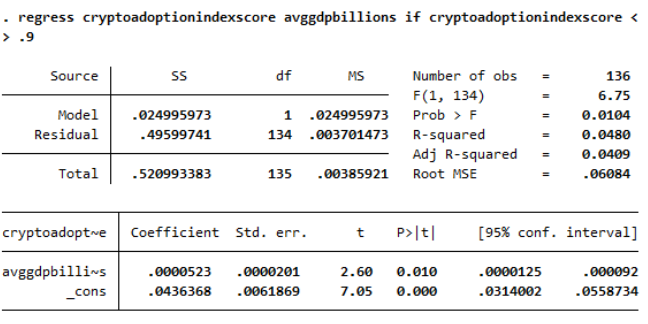
The next regression is the same cryptocurrency adoption score with GDP, but with Vietnam removed. The result is significant (P = .01). Vietnam appeared to have been a strong outlier in this particular case, as the removal of Vietnam greatly increased the significance of the results of this regression. However, the result is still not as significant as peer-to-peer transaction volume ranking nor overall crypto adoption ranking.
Overall Regression Findings
After analyzing the regressions, there is an abundance of evidence that they are supportive of both of the hypotheses. First, peer-to-peer transactions rankings favored countries under the measured forms of economic stress. The regressions suggest that countries with higher inflation tended to rank higher in peer-to-peer transaction volume use. Additionally, countries with lower GDP output and lower economic freedom scores also tended to rank higher in their peer-to-peer transaction volume. The majority of these results also produced adequate P values to suggest statistical significance. There is also a divergence present between the peer-to-peer transaction results and the overall crypto adoption results. While several overall crypto adoption regressions did produce significant results, several others did not. Additionally, the P values of these regressions were consistently lower than their peer-to-peer transaction counterparts in every regression except overall cryptocurrency adoption ranking with GDP, which produced the same P value of 0.00 as peer-to-peer transaction ranking and GDP. However, the results of this particular regression actually showed a trend of countries with higher GDP output favoring higher overall cryptocurrency adoption. The peer-to-peer version of this regression produced an opposite trend, in which countries with lower GDP output favored peer-to-peer transactions. Both of these results being equally as significant has promising implications toward the hypotheses.
What Would Improve The Results?
There are two measures that may further improve these results in the future. The first is using 2022 cryptocurrency adoption rankings. Chainalysis’ Geography of Cryptocurrency study was published in October of 2021. Having more recent numbers to compare with inflation data would be incredibly beneficial, especially considering the higher-than-average amount of economic turmoil that occurred through 2021 into 2022. This includes historic global inflation, a historic rise in global commodities prices such as wheat and oil, and increased potential of recessions in countries across the globe. Ideally, the results of these measurements should increase in their significance with updated economic and cryptocurrency adoption data for 2022 given all of the economic volatility that has occurred.
The second measure that would improve the accuracy of this study involves receiving a peer-to-peer transaction score to run regressions along with the peer-to-peer transaction ranking. Unfortunately, the Chainalysis study only provided how countries comparatively rank with one another for their respective peer-to-peer transaction volumes. Only overall cryptocurrency adoption metrics were accompanied by a score as well as a ranking. Assigning an actual data point or score would help provide additional context to a country's peer-to-peer transaction volume behavior. Additionally, having datasets that span several years backward can also help identify trends in this data. For example, was it not until Venezuela's currency collapse event that it began to rank highly in peer-to-peer transaction volume, or did this trend start years before or after hyperinflation began in 2016? Some insights from analyst Matt Alborg will provide helpful context to this further along in the study, but having access to Chainalysis data on this topic would help provide more context to the regression results as well.
Natural Studies
The countries selected for natural studies include post-2016 Venezuela, post-2021 Turkey, and post-2018 Zimbabwe. All of these selections suffered from dramatic inflation events.. Venezuela and Zimbabwe rank highly for peer-to-peer transaction volume, while Turkey ranks highly for overall adoption. Turkey ranks near the bottom of the list for peer-to-peer transactions, however, because Turkey has made such transactions illegal.
Along with natural studies pertaining to economic turmoil with inflation or low economic output, there is also the prevalent and current case of Ukraine and Russia. In February of 2022, Russia launched a full scale invasion of Ukraine. During the invasion, two narratives emerged pertaining to cryptocurrency. One narrative suggested that Russia was using cryptocurrency as a means to reconcile the impact of sanctions that were placed on them by countries around the globe. Russia was removed from SWIFT, the international system that connects financial institutions worldwide. Russia’s ban from SWIFT made it significantly harder for Russia to move money. The narrative that Russia had transitioned to using cryptocurrency more frequently emerged as a result from this ban. The second narrative involved Ukraine using cryptocurrency during the invasion. Many claims were made that cryptocurrency was used for citizens to easily evacuate with their savings, as well as collect revenue to fund Ukrainian war efforts faster than traditional banking systems could allow for. Are these narratives true, and if yes, to what extent? Looking further into the use of cryptocurrency in volatile geopolitical and economic situations may lead to more clues on the incentive structure of crypto users in dire situations. This includes the inflation events in Venezuela, Turkey, and Zimbabwe, as well as the outbreak of wars in Ukraine, Russia, and the Middle East.
Conclusion
While there is still more to do with data reporting quality and geopolitical developments in relation to peer-to-peer cryptocurrency use, this analysis has suggested evidence that P2P usage does indeed increase in dire situations with regards to inflation, economic freedom, and economic output. The body of regressions analyzed, overall, are promising in suggesting significance in the data for how users transact economically depending on the conditions of their environment.
Works Cited
“2022 Index of Economic Freedom.” Index of Economic Freedom: Promoting Economic Opportunity and Prosperity by Country, https://www.heritage.org/index/.The economic freedom index compiles a number of economic indicators and scores countries based on their performance. The economic freedom score is made by measuring a country's respective policies on factors such as rule of law, government size, regulatory efficiency, and market freedom pertaining to factors such as trade and investment.
Goyeneche, Ainhoa, and Dana Khraiche. “Lebanon's Inflation Rate Is Worse than Zimbabwe's and Venezuela's.” Business and Economy News | Al Jazeera, Al Jazeera, 21 Sept. 2021, https://www.aljazeera.com/economy/2021/9/21/lebanons-inflation-rate-is-worse-than-zimbabwes-and-venezuelas. Used to retrieve recent inflation data in Lebanon
International Monetary Fund. “World Economic Outlook Database.” 2022, https://www.imf.org/en/Publications/WEO/weo-database/2021/October/weo-report. Accessed 15 Apr. 2022.This dataset compiles the necessary inflation data to conduct the study. Along with the economic freedom index, it will serve as the primary point of reference for all non-crypto related economic data for the purpose of the study.
“The Blockchain Data Platform.” Chainalysis: The 2021 Geography Of Cryptocurrency Report, Chainalysis , 30 Mar. 2022, https://www.chainalysis.com/.Chainalysis' 2021 Geography of Cryptocurrency report provides all of the data necessary to analyze and rank countries by both their cryptocurrency and defi adoption rates. This report does not provide adoption and use rates for specific projects, such as Bitcoin or Ethereum, which would be necessary to calculate money velocity. It is worth noting that many of the rankings provided in this report adjust the metrics to internet access, normalizing the data for countries less technologically fortunate than others.
“Afghanistan GDP2022 Data - 2023 Forecast - 1960-2021 Historical - Chart - News.” Afghanistan GDP - 2022 Data - 2023 Forecast - 1960-2021 Historical - Chart - News, https://tradingeconomics.com/afghanistan/gdp#:\~:text=GDP%20in%20Afghanistan%20is%20expected,according%20to%20our%20econometric%20models. Used to retrieve GDP data on Afghanistan.
“Afghanistan Inflation Rate 2022: Consumer Price Index.” Take Profit Afghanistan Inflation, https://take-profit.org/en/statistics/inflation-rate/afghanistan/#:\~:text=What%20is%20Afghanistan%20Core%20Inflation,and%20minimum%20was%20%2D3.69%20%25. Used to retrieve inflation data on Afghanistan.
Ahlborg, Matt. “Nuanced Analysis of LocalBitcoins Data Suggests Bitcoin Is Working as Satoshi Intended.” Medium, Medium, 20 May 2019, https://medium.com/@mattahlborg/nuanced-analysis-of-localbitcoins-data-suggests-bitcoin-is-working-as-satoshi-intended-d8b04d3ac7b2. Used to study geographical trends in cryptocurrency, and add additional context from a previous analyst who has researched this topic in the past.
“Argentina Inflation RateJune 2022 Data - 1944-2021 Historical - July Forecast.” Argentina Inflation Rate - June 2022 Data - 1944-2021 Historical - July Forecast, https://tradingeconomics.com/argentina/inflation-cpi. Used to retrieve recent inflation data for Argentina.
“GDP Growth (Annual %) - Syrian Arab Republic.” Syrian Inflation Data, 2022, https://data.worldbank.org/indicator/NY.GDP.MKTP.KD.ZG?end=2019&locations=SY&start=2003. Used to retrieve GDP data for Syria.
Gladstein, Alex, and Anthony Pompliano. “Currency of Last Resort.” Bitcoin Magazine - Bitcoin News, Articles and Expert Insights, Bitcoin Magazine - Bitcoin News, Articles and Expert Insights, 4 May 2022, https://bitcoinmagazine.com/culture/currency-of-last-resort.
“Pakistan GDP2022 Data - 2023 Forecast - 1960-2021 Historical - Chart - News.” Pakistan GDP - 2022 Data - 2023 Forecast - 1960-2021 Historical - Chart - News, 2022, https://tradingeconomics.com/pakistan/gdp#:\~:text=GDP%20in%20Pakistan%20is%20expected,according%20to%20our%20econometric%20models. Used to retrieve GDP data for Pakistan.
“Syria Nominal GDP.” Syria | Nominal GDP | 1990 – 2022 | CEIC Data, https://www.ceicdata.com/en/indicator/syria/nominal-gdp. Used to retrieve GDP data for Syria.
Themes-Lab. “ .” UsefulTulips, Matt Alborg, https://www.usefultulips.org/. Several of Matt's metrics were used to cross-reference the data I presented. Additionally, Matt put together some visualizations on the geographical progress of peer-to-peer transactions. Matt and I met via videochat to go over several of his findings while researching similar topics, and gave me permission to cite his works for the purposes of this study.
Annotated Dataset
This is the file used that contains all of the data that was used for the regressions ran for this study. Any data that was altered or came from different sources is annotated.


评论 (0)