


Author: lesley@footprint.network
Data Source: MATIC Token Dashboard (Only data on Ethereum included)
Token analysis plays a pivotal role in the realm of cryptocurrency and digital assets. It is the process of delving deep into the data and market behaviors associated with these assets. It is a detailed process that involves thoroughly examining price and liquidity connected to these assets.
By analyzing tokens, we gain invaluable insights into market trends, risk factors, trading activities, and the direction of capital flows.
MATIC is the native token of the Polygon blockchain. It plays a pivotal role in governing and securing the Polygon network, as well as facilitating transaction fees within the ecosystem. Investors can acquire MATIC tokens through various cryptocurrency exchanges, including Coinbase and Kraken. Polygon offers a versatile platform for decentralized applications and services, making MATIC tokens an integral part of the ecosystem.
How to Analyze MATIC Token?
Token analysis is of paramount importance, and in this context, what are the key metrics to consider?

MATIC Token Price per Day for the Last 30 Days
Token Price Analysis: Understanding Market Cap and Price Fluctuations
The token price is a crucial metric that represents the value of the token in fiat currency or cryptocurrency. As of 2024–01–22, the token’s price is $0.7777, which indicates a decrease of approximately 8.77% over the last month. Analyzing this price trend through diagnostic analytics provides insights into the token’s performance and potential predictive trends.
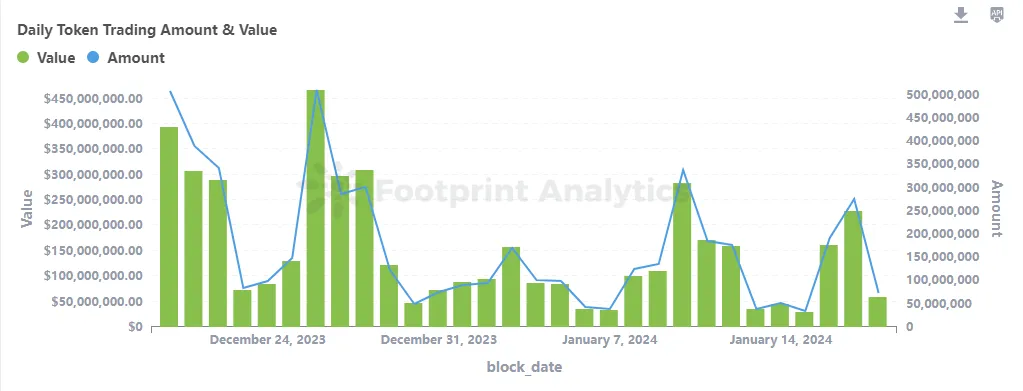
MATIC Daily Token Trading Amount & Value
Trading Value Insights: A Diagnostic Tool in Crypto Analytics
The volume of token trades is a key indicator of market activity. Currently, the token’s trading volume stands at approximately $46,271,783. Analyzing this trend using various data analytics shows that the 7-day moving average of the trading volume is around $126,335,893. This moving average indicates a general trend in the trading activity over the past week, providing a smoothed perspective of market dynamics.
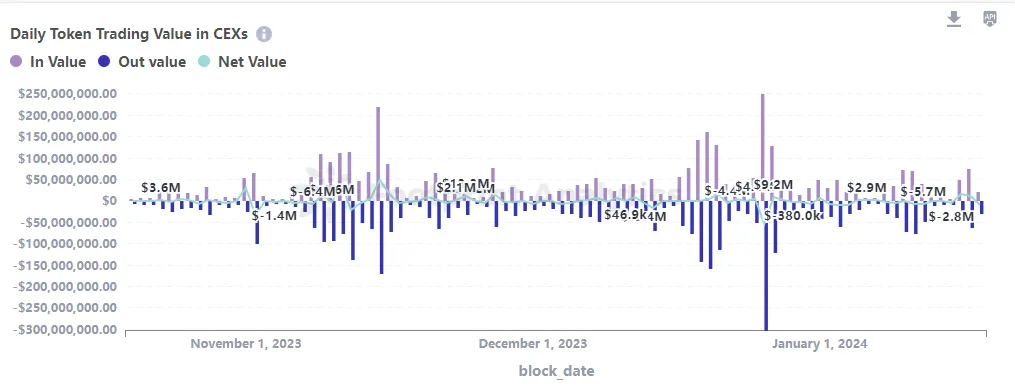
MATIC Daily Token Trading Value in CEXs
Net Flow Analysis in CEX: Identifying Trends in Investor Behavior
To gain a deeper understanding of investor behavior, it is essential to analyze the net flow of tokens in and out of centralized exchanges (CEXs). This analysis not only tracks the quantity of tokens moving into and out of exchanges but also examines the broader implications of these movements in relation to market trends, investor confidence, and liquidity.
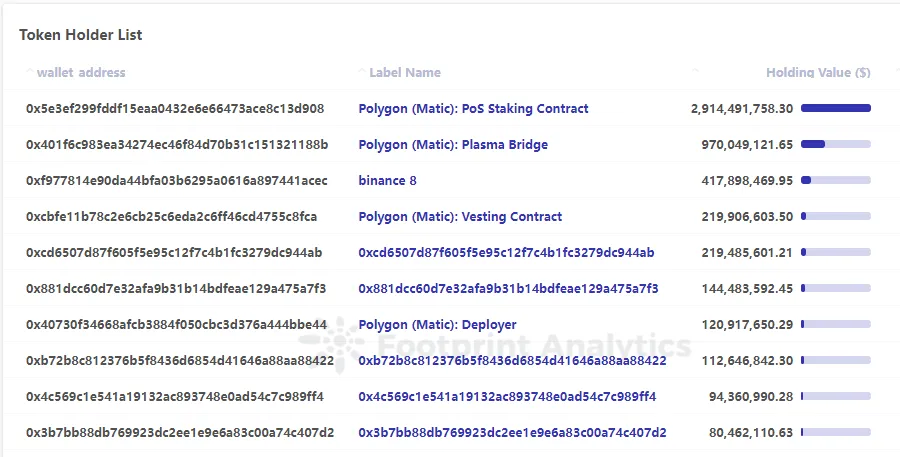
MATIC Token Holder List
Token Centralization: A Descriptive Analytics Approach
To understand market integrity and susceptibility to manipulation, it is crucial to evaluate token centralization. By analyzing the distribution of tokens among top holders, we can gain insights into the influence of whale investors and the overall health of the token market.
Footprint Analytics is a blockchain data solutions provider. It leverages cutting-edge AI technology to help analysts, builders, and investors turn blockchain data and combine Web2 data into insights with accessible visualization tools and a powerful multi-chain API across 30+ chains for NFTs, GameFi, and DeFi.
Product Highlights:
- Data API for developers.
- Footprint Growth Analytics (FGA) for GameFi projects.
- Batch download for big-size data fetch.
- View the data dictionary to explore all data sets Footprint provides.
- Check our X post (Footprint_Data) for more product updates.


评论 (0)